
Disclosure: Kafe360 is Flatinium’s own product. We wrote its code, planned its content and sell SEO and GEO services. That gave us full access to the data, and it is also a reason to read the numbers critically. The limits are listed below.
Key numbers
133
live businesses using Kafe360 (September 2026), all in Turkey
236×
weekly Google impressions: 172 → 40,575
44×
weekly clicks: 18 → 791
12.8 → 6.0
average position, same two weeks
2,767
clicks in the last 28 days (previous 28 days: 1,358)
~4%
of clicks from brand queries; growth came from non-brand searches
Weekly comparisons: 30 May – 5 June vs 12 – 18 September 2026. Search data: Google Search Console API, pulled 27 September 2026.
The starting point
The first commit was made on 1 March 2026, with zero code and zero traffic. The audience was café and restaurant owners in Turkey; the product, cloud-based POS and QR menus. We did not start with commercial keywords. We started with the questions business owners actually type.
What we built
The product
Kafe360 is a cloud-based SaaS built from scratch with NestJS, Next.js, PostgreSQL, Redis, BullMQ, Socket.IO, Docker and Cloudflare. As of 27 September 2026 the codebase had 719 commits, 55 modules and 75 data models. A support assistant called Fincan runs on Claude Haiku 4.5 with read-only tools and diagnoses problems by looking at the business’s own data. There is a free-forever QR menu plan alongside the paid POS.
Topic selection: who writes this sentence?
Every topic passed one test: who would type this query? Not an SEO professional, but a business owner. That moved the plan away from technical terms and towards regulation, licences, costs and fines. Topics were picked from gaps in Search Console data and then put through that test. By 27 September 2026 the site had 208 blog posts, 49 knowledge base articles and 12 city pages; the sitemap listed 325 URLs.
The GEO template
In July we moved the content to a single GEO template built to be quoted:
- Summary box at the top of each post: short, self-contained points an AI answer engine or a hurried reader can lift directly.
- Visible FAQ and FAQPage markup from one source, so the on-page answers and the structured data cannot drift apart.
- Comparison tables wherever the content compares options, costs or rules.
- Speakable markup.
The site also publishes an llms.txt file and Organization, SoftwareApplication, FAQPage and HowTo structured data.
Internal link map
We measured the internal link graph when the site had 174 posts: 29 of them received no internal links at all. We brought orphan posts to 0 and total internal links went from 850 to 908. Since then, every new post gets at least two inbound internal links.
Tools, single-source numbers and indexable QR menus
Two free tools sit next to the content: a café opening cost calculator and a café name generator with 1,236 names, plus a city guide. The calculator engine and the cost tables in blog posts read from the same code, so a number never says one thing in a post and another in the tool. And because each customer’s QR menu is published on its own subdomain with a sitemap, every menu is indexable in Google: each new business adds a small, real page to the product’s search footprint.
No paid advertising
No ads were run during this period. All search traffic reported here is organic.
Search Console data
Five key weeks (Friday-start weeks, as pulled on 27 September 2026):
| Week (2026) | Clicks | Impressions | Avg. position |
|---|---|---|---|
| 30 May – 5 Jun | 18 | 172 | 12.8 |
| 11 – 17 Jul | 50 | 1,378 | — |
| 18 – 24 Jul | 130 | 3,770 | — |
| 25 – 31 Jul | 248 | 10,601 | — |
| 12 – 18 Sep | 791 | 40,575 | 6.0 |
Last 28 days vs the previous 28 days
| Metric | 28 Aug – 24 Sep | Previous 28 days | Change |
|---|---|---|---|
| Clicks | 2,767 | 1,358 | ×2.04 |
| Impressions | 143,374 | 63,355 | ×2.26 |
| Average position | 6.2 | 7.0 | — |
Daily average impressions over the last 28 days: 5,120. Brand queries (“kafe360” and its variants) brought about 114 clicks in that period, roughly 4% of the total.
Most-clicked pages (last 28 days)
| Page (Turkish) | Clicks | Avg. position |
|---|---|---|
| Café name generator (tool, 1,236 names) | 229 | — |
| Music copyright licence for cafés (article) | 212 | 4.9 |
| Food inspection checklist (article) | 184 | 3.4 |
| Hookah café licence (article) | 167 | 3.5 |
| Café opening cost calculator (tool) | 139 | — |
| KOSGEB small-business support (article) | 118 | — |
None of the six is an SEO term. Each answers a practical need of a café owner: a name, copyright licences, inspections, a licence, costs, state support.
The late-July break
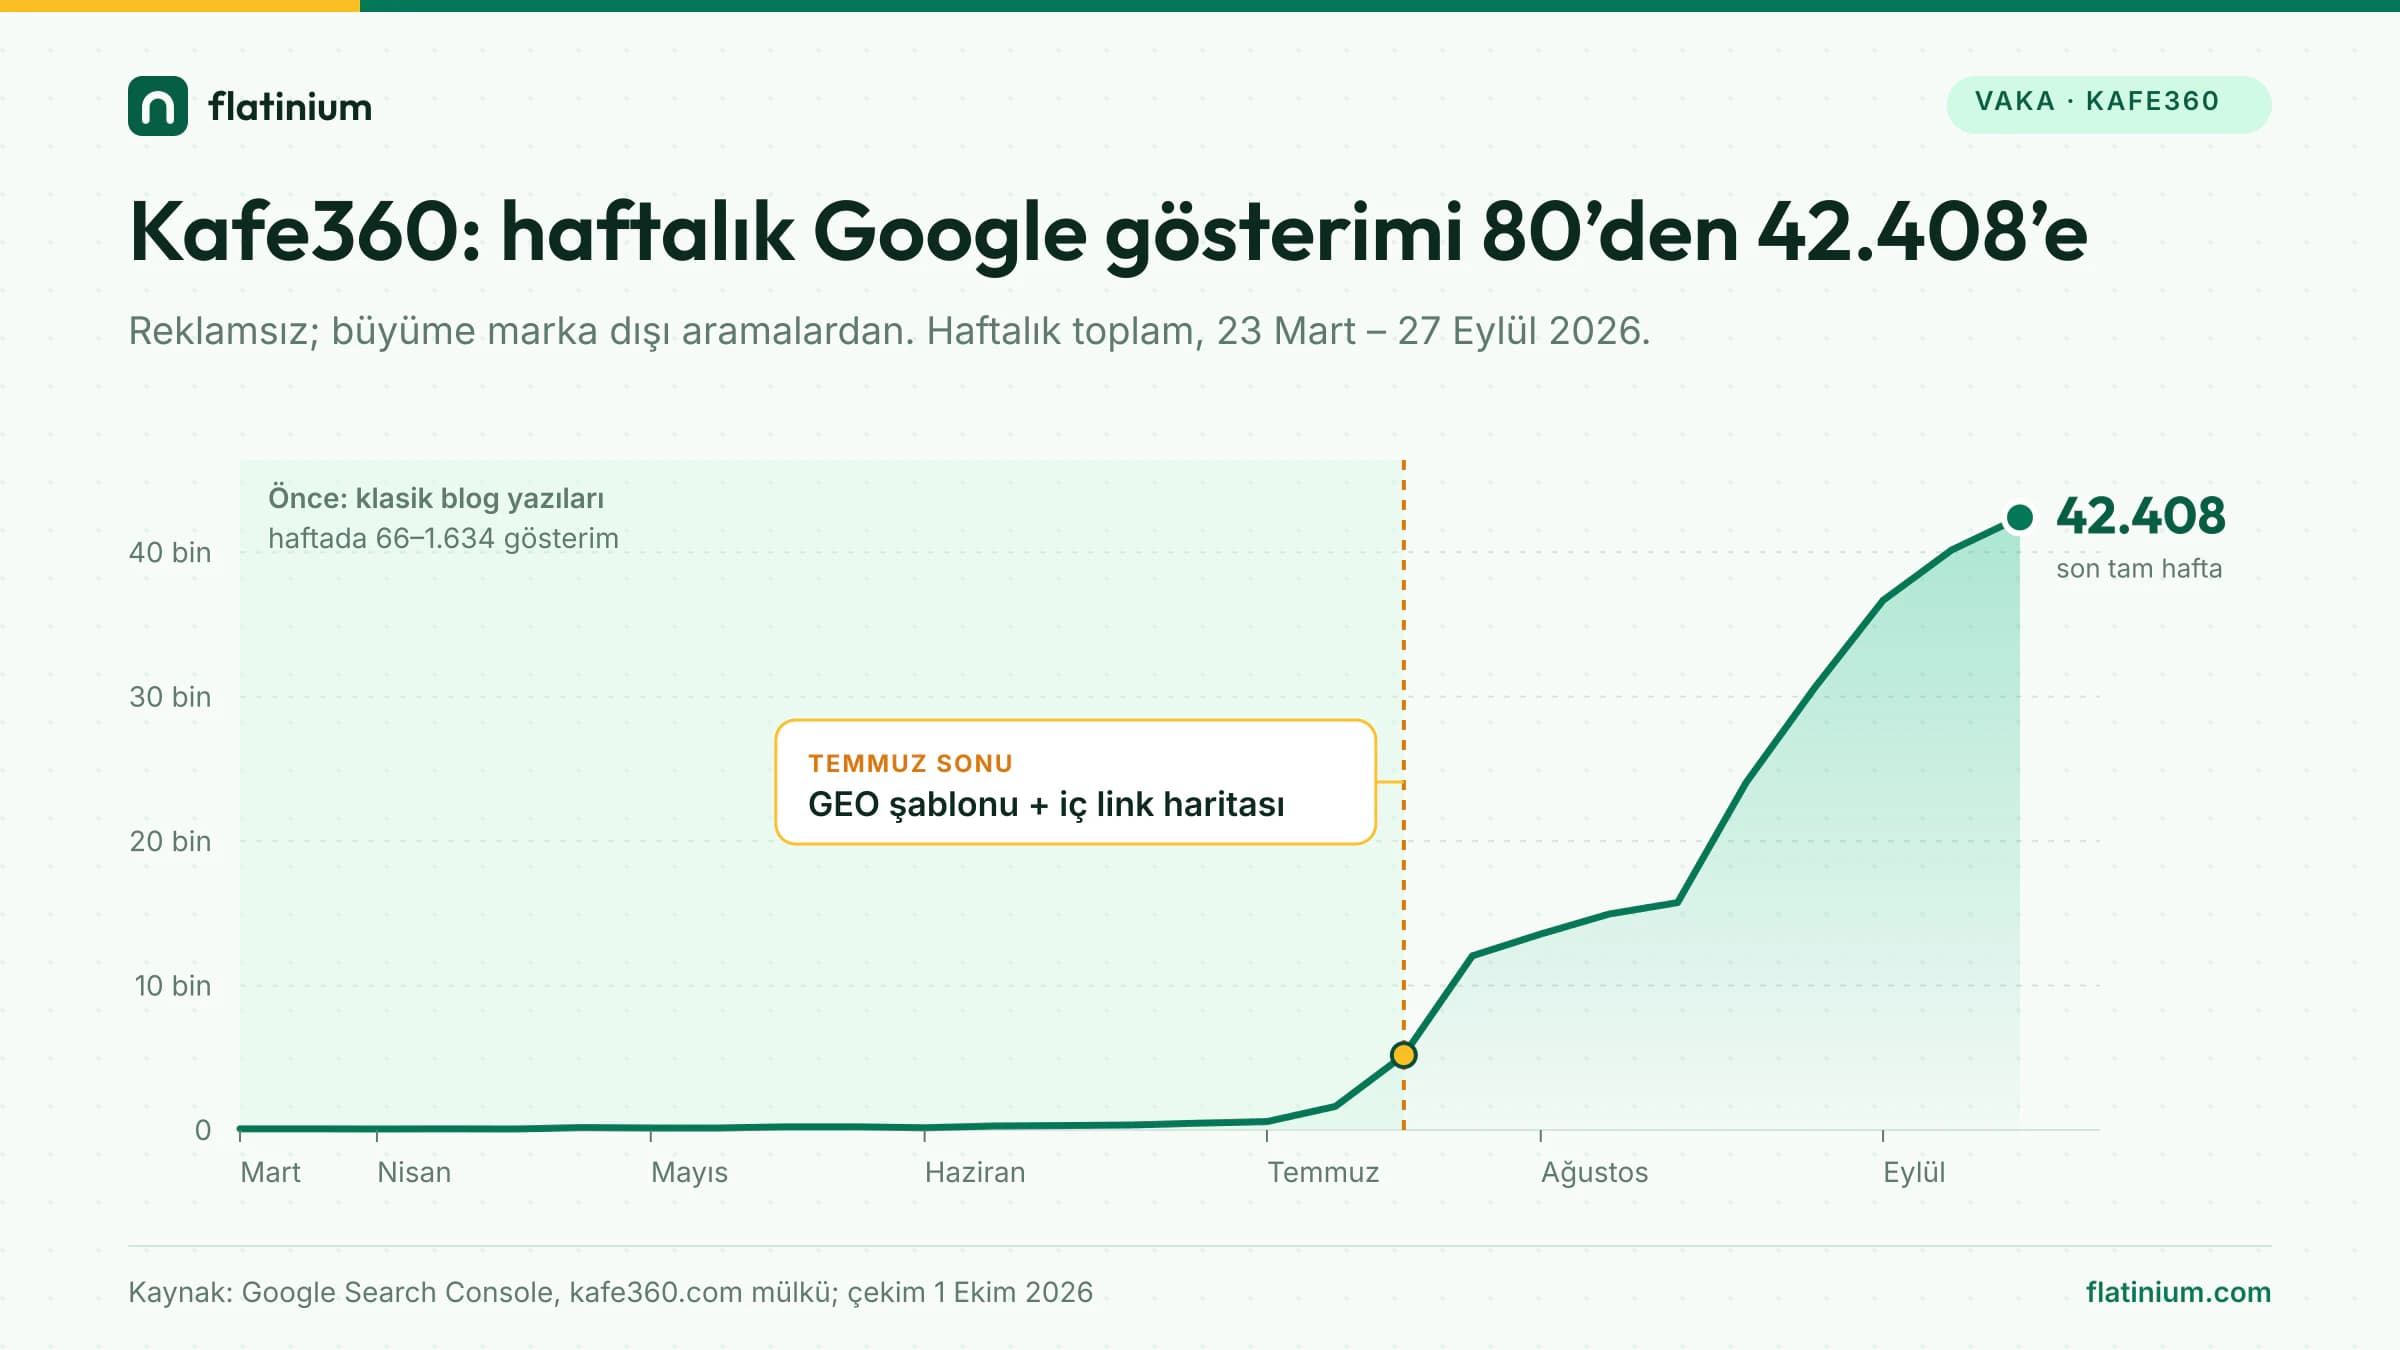
Weekly impressions were 172 at the end of May. In the second half of July they went from 1,378 (11 – 17 July) to 3,770 and then 10,601 (25 – 31 July). Two changes landed in those same weeks: the move to the GEO template and the internal link map that brought orphan posts from 29 to 0. We did not run a controlled experiment, so we cannot say how much each change contributed. What we can say is that the curve bent when both shipped and kept rising afterwards, to 40,575 impressions in the week of 12 – 18 September.
Live businesses grew over the same period: 60 on 12 June, 68 on 29 June, 104 on 12 August and 133 in September 2026.
What we learned
- Write in the buyer’s words. The pages that earn the most clicks answer owners’ practical questions, not the most technical ones.
- Organic growth is not linear. For months the curve was almost flat; the return on accumulated content arrived late and suddenly.
- Unmeasured internal links decay. 29 of 174 posts had become orphans without anyone noticing.
- Numbers need one source. Tool and article tables reading from the same code removes contradictions, for readers and for AI answer engines.
- The product is content too. Free tools and indexable customer menus opened a surface that articles alone would not have reached.
- Writing for AI search is writing for people. The summary box, tables and clear FAQs were added for hurried readers first; the same structure turned out to suit AI answer engines.
What this case does not prove
- One site. This is a single domain in a single market (Turkish-language, Turkey). It is not a sample, and the result may not repeat elsewhere.
- Our own product. We controlled the code, the content and the release schedule, and had direct access to every number. A client project rarely has all of that.
- Sector and seasonal effects. We have no control group. Demand in the café and restaurant sector, or changes in Google itself, may have moved in the same weeks, and we cannot separate those from our changes.
- Correlation, not causation. The GEO template and the internal link map shipped in the same weeks; the timing matches, the mechanism is not proven.
- Impressions are not revenue. 133 is the number of live businesses in the product database. We do not publish paying customer counts, revenue or churn.
- No ranking guarantee. Nothing here implies that the same steps produce the same rankings for anyone else.
Methodology and data sources
- Search data: Google Search Console API, property
sc-domain:kafe360.com. Key weeks, the 28-day comparison, brand share and top pages were pulled on 27 September 2026, using Friday-start weeks. - Weekly series (chart and table below): same API,
dimensions=date, summed into Monday-start full weeks, pulled on 1 October 2026. The partial first week (from 17 March) and last week (from 28 September) are excluded. Because the week boundaries differ, these values do not match the key-week table one to one. - Product data: git history (first commit, commit count), the codebase and Prisma schema (modules, data models) and the product database (live businesses), as of 27 September 2026.
- Derived ratios: 172 → 40,575 = 236×; 18 → 791 = 44×; 28-day clicks ×2.04 and impressions ×2.26.
Full weekly series: 27 Monday-start weeks, 23 March – 27 September 2026
| Week starting | Clicks | Impressions |
|---|---|---|
| 23 Mar | 19 | 80 |
| 30 Mar | 10 | 88 |
| 6 Apr | 8 | 66 |
| 13 Apr | 14 | 89 |
| 20 Apr | 13 | 74 |
| 27 Apr | 24 | 164 |
| 4 May | 17 | 137 |
| 11 May | 14 | 134 |
| 18 May | 37 | 218 |
| 25 May | 14 | 219 |
| 1 Jun | 22 | 156 |
| 8 Jun | 19 | 273 |
| 15 Jun | 24 | 300 |
| 22 Jun | 45 | 352 |
| 29 Jun | 39 | 465 |
| 6 Jul | 24 | 588 |
| 13 Jul | 59 | 1,634 |
| 20 Jul | 163 | 5,185 |
| 27 Jul | 257 | 12,063 |
| 3 Aug | 298 | 13,576 |
| 10 Aug | 291 | 14,958 |
| 17 Aug | 366 | 15,742 |
| 24 Aug | 468 | 24,058 |
| 31 Aug | 599 | 30,615 |
| 7 Sep | 695 | 36,658 |
| 14 Sep | 785 | 40,160 |
| 21 Sep | 825 | 42,408 |
Disclosure
Kafe360 is Flatinium’s own product. Flatinium built it from scratch and runs its content and search work. Flatinium also sells SEO and AI search optimization services, so this page is both a case study and an example of our work. No client data is used, and no customer business is named.
Read more
- Full Turkish version of this case study (product details, content clusters and a seven-month timeline).
- Turkey business websites study 2026: 937 business websites in Ankara, Istanbul and İzmir, open data.
- AI search optimization (GEO) (in Turkish).
- Restaurant and café SEO (in Turkish).
Contact and citation
Questions, data requests or interviews: info@flatinium.com. If you cite this case, please use “Flatinium, Kafe360 case study, October 2026” with a link to this page.